完整文件在 github 上:机器学习作业2
点个小星星呗
逻辑回归
回归,是指假设一个模型,设定一些参数,计算合适的参数以拟合逼近现有数据。
Linear Regression
Logistic Regression
线性回归用一条直线模型去拟合数据,用来确定两种或两种以上变量间相互依赖的定量关系
逻辑回归计算样本属于某个标签的概率,构建一个分类边界,用来对数据进行二分类或者多分类。
上次实验我们用梯度下降训练了一个线性回归模型,这次我们实现一个逻辑回归模型来进行二分类的收入判断任务。
注意事项:
本实验可能用到的函数:np.mean np.add np.sum np.mutual np.dot
本实验大部分变量为numpy array的数据类型
In [ ]:
from google.colab import drive
drive.mount('/content/drive')
Drive already mounted at /content/drive; to attempt to forcibly remount, call drive.mount("/content/drive", force_remount=True).
任务一:读取和预处理数据
第一步导入数据。压缩包中的train.csv中存储了原始数据,每人拥有年龄,工作类型等14个维度,共32561个样本。最后一个维度为本次实验的label,即收入是否大于50k。
做机器学习应用的时候很多时间是花费在特征处理上,我们注意到原始数据存在许多维度为非数字的数据,是不能直接用于构建模型的。我们可以通过离散化,把一个维度扩展到多个维度。如教育程度:(小学,初中,高中+)可以被扩展到如下三个维度:小学学历(是,否),初中学历(是,否),高中学历以上(是,否)。
经上述处理后的数据存储在X_train文件中,每个样本的维度被扩展到了106维,本实验直接使用其中的数据构建模型。
In [ ]:
import numpy as np
from matplotlib import pyplot as plt

def getdata(X_train,Y_train):
    X = np.genfromtxt(X_train,delimiter=',',skip_header=1) #32561个样本*106个特征
    Y = np.genfromtxt(Y_train,delimiter=',',skip_header=1) #32561个label
    return X,Y

def shuffle(X,Y):
    #打乱X,Y,避免数据存在初始的排序,影响训练效果
    randomize = np.arange(len(X)) #不同的库用的不太一样,返回的对象也不太一样。python自带的range()不支持numpy的shuffle
    np.random.shuffle(randomize)
    return (X[randomize], Y[randomize]) #ndarray的参数是数组时,返回一个依参数排序后的数组

def train_test_split(X, Y, test_size=0.1155):
    #按一个比例分出一部分验证集
    train_len = int(round(len(X)*(1-test_size)))
    return X[0:train_len], Y[0:train_len], X[train_len:None], Y[train_len:None]

X,Y = getdata('/content/drive/MyDrive/ML_HW/ML_HW2/X_train','/content/drive/MyDrive/ML_HW/ML_HW2/Y_train')
X, Y, X_test, Y_test = train_test_split(X, Y)

X.shape #out: (28800, 106)
Out[ ]:
(28800, 106)
任务二:数据归一化
归一化把每个特征的数据映射到0到1之间,消除指标之间的量纲影响,同时可以避免某些特征对模型预测结果的影响过大。
常用的归一化方法有两种: 一是利用最大最小值(min-max 归一化);
二是利用平均值方差(z-score 0均值标准化)。
一般来说0均值标准化调整了数据的分布,使之更易于训练。
In [ ]:
def normalization(X):

    """将X中的数据映射到0-1之间
    参数:
        X:数据
    返回:
        归一化之后的X
    注意:
        测试在只归一化0,1,3,4,5,7,10,12,25,26,27,28列特征时,效果会比较好
        具体原因可探讨
    """
    ### START THE CODE ###
    index=[0,1,3,4,5,7,10,12,25,26,27,28]
    mu = np.mean(X,axis=0)
    sigma = np.std(X,axis=0)
    X[:,index] = (X[:,index]-mu[index])/sigma[index]

    ### END THE CODE ###

    return X

X = normalization(X)
X_test = normalization(X_test)
X[:1]
Out[ ]:
array([[ 0.02890209, -1.06650057,  1.        ,  0.14210542, -0.21597229,
        -0.03377446,  0.        , -0.26245687,  0.        ,  0.        ,
        -0.18897204,  0.        ,  4.90786186,  0.        ,  0.        ,
         0.        ,  0.        ,  0.        ,  0.        ,  0.        ,
         0.        ,  0.        ,  0.        ,  0.        ,  1.        ,
        -0.11423684, -0.69141886, -0.23563746, -0.03999722,  0.        ,
         0.        ,  0.        ,  0.        ,  0.        ,  0.        ,
         1.        ,  0.        ,  0.        ,  1.        ,  0.        ,
         0.        ,  0.        ,  0.        ,  0.        ,  0.        ,
         0.        ,  0.        ,  0.        ,  0.        ,  0.        ,
         0.        ,  0.        ,  0.        ,  0.        ,  1.        ,
         0.        ,  0.        ,  0.        ,  0.        ,  0.        ,
         0.        ,  0.        ,  0.        ,  1.        ,  0.        ,
         0.        ,  0.        ,  0.        ,  0.        ,  0.        ,
         0.        ,  0.        ,  0.        ,  0.        ,  0.        ,
         0.        ,  0.        ,  0.        ,  0.        ,  0.        ,
         0.        ,  0.        ,  0.        ,  0.        ,  0.        ,
         0.        ,  0.        ,  0.        ,  0.        ,  0.        ,
         0.        ,  0.        ,  0.        ,  0.        ,  0.        ,
         0.        ,  0.        ,  0.        ,  0.        ,  0.        ,
         0.        ,  0.        ,  1.        ,  0.        ,  0.        ,
         0.        ]])
任务三:完成sigmoid函数
sigmoid funtion函数原指曲线是 “S”形的函数,logistic function则指满足某个公式形式的一系列函数。 在机器学习中,其一般特指以下函数(standard logistic function):
In [ ]:
def sigmoid(z):
    """
    参数:
        z
    返回:
        sigmoid(z)
    """
    ### START THE CODE ###

    s=1.0/(1+np.exp(-z))

    ### END THE CODE ###

    return np.clip(s, 1e-6, 1-1e-6)
    #clip:重要的处理,将超出范围的值强制置为边界值,避免y_pred为0,从而导致下面交叉熵损失无法计算
    #aeN: a*10的N次方

sigmoid(0.3) #out:0.574442516811659
Out[ ]:
0.574442516811659
任务四:完成交叉熵损失函数
损失函数用于评价模型预测同实际情况的差异,越小说明预测越准确。
概念上, 损失函数针对单个样本,代价函数针对总体。但作为优化目标时二者无不同。
交叉熵数学意义上衡量的是两个概率分布间的差异,本实验以交叉熵损失为优化目标函数。
In [ ]:
def cost(y_pred, y_label, m):
    """代价函数,这里计算的是所有样本损失函数的和
    参数:
        y_pred:模型预测的值
        y_label:数据实际的标签
        m:数据的样本数
    返回:
        cst: 预测值同标签值之间的代价
    """
    ### START THE CODE ###


    cst = -np.mean(y_label*np.log(y_pred)+(1-y_label)*np.log(1-y_pred))


    ### END THE CODE ###

    return cst

cost(0.5,0.5,1) #out:0.6931471805599453   numpy的log以e为底
Out[ ]:
0.6931471805599453
任务五:构建逻辑回归模型
接下来先设置模型所需要的参数,可以自己修改观察对模型的影响。
对于样本的偏置θ0,有两种处理方法: 一种是作为一个维度添加到array θ上,相应样本也要添加一个值全为1的维度;
一种是单独拿出来更新,在梯度下降时分别处理。
本实验采取的是第二种方法。
最后完成模型所需的两个基本函数predict,和accuracy。
In [ ]:
#模型的基本参数:
theta = np.zeros(X.shape[1],) #106个权重参数,初值全为0
theta_0 = np.zeros(1,) #1个偏置参数,初值为0

#训练参数
max_iter = 40 #迭代次数
batch_size = 32 #随机梯度下降中每次取样个数
learning_rate = 0.02 #学习率,可以尝试不同的学习率,如0.2、0.002、0.0002
num_train = len(Y)
num_test = len(Y_test)

#用于记录训练中损失和准确率的变化
train_cost = []
test_cost = []
train_acc = []
test_acc = []

def predict(X, theta, theta_0):
    """预测
    参数:
        X:样本特征
        theta:权重参数
        theta_0: 偏置参数
    返回:
        Y_pred: 样本的预测值 0~1
    """
    ### START THE CODE ###
    Y_pred = sigmoid(np.dot(X,theta)+theta_0)
    ### END THE CODE ###

    return Y_pred

def accuracy(Y_hat, Y_label):
    """准确率
    参数:
        Y_hat:样本最终分类 0 or 1
        Y_label:样本标签
    返回:
        acc: 分类准确率
    """
    ### START THE CODE ###
    y_re = list(Y_hat - Y_label)
    acc = y_re.count(0)/len(Y_label)
    ### END THE CODE ###

    return acc

predict([0.5,1],[0,0.2],[0.1]) #out: array([0.57444252])
Out[ ]:
array([0.57444252])
任务六:用随机梯度下降算法训练模型
全样本的梯度下降,在样本过大时,更新一次参数会需要巨大计算量。我们可以每次从中随机取出一定大小的样本,进行小批量随机梯度下降。 随机取样部分已完成,只需根据样本梯度下降更新参数即可。
根据我们的优化目标(默认为交叉熵),对损失函数求导,得到梯度计算公式为:(推导见ppt)
θ,θ0更新时分别处理
In [ ]:
def gradient_descent(x_bt, y_bt, theta, theta_0, learning_rate):
    """用每次取出的一个batch的数据训练模型
    参数:
        x_bt:本次更新所用样本
        y_bt:本次更新样本的标签
        theta,theta_0:模型参数
    过程:
        用theta,theta_0进行一次预测
        计算预测误差
        计算theta, theta_0的梯度,取均值
        用梯度更新theta_0和theta
    """
    ### START THE CODE ###
    y_pre = predict(x_bt,theta,theta_0)
    gra_theta = np.dot(y_pre-y_bt,x_bt)
    gra_theta_0 = np.mean(y_pre-y_bt)
    theta = theta - learning_rate * gra_theta
    theta_0 = theta_0 - learning_rate * gra_theta_0

    ### END THE CODE ###

    return theta,theta_0

gradient_descent(np.array([[1]]),np.array([1]),np.array([0.1]),np.array([0.1]),0.2)
#out: (array([0.1900332]), array([0.1900332]))
Out[ ]:
(array([0.1900332]), array([0.1900332]))
In [ ]:
def train(X, Y, theta, theta_0, max_iter, batch_size, learning_rate):
    train_cost = []
    test_cost = []
    train_acc = []
    test_acc = []

    for epoch in range(max_iter):
        X, Y = shuffle(X, Y) #随机打乱各行数据,这样参数不易陷入局部最优,模型能够更容易达到收敛。
        for i in range(int(np.floor(len(Y)/batch_size))): #每个batch更新一次
            x_bt = X[i*batch_size:(i+1)*batch_size] #32个样本*106维
            y_bt = Y[i*batch_size:(i+1)*batch_size] #32个label

            #每个batch的样本更新参数theta,theta_0
            theta,theta_0 = gradient_descent(x_bt,y_bt,theta,theta_0,learning_rate)

        #记录每个epoch更新后,训练集上损失的变化和准确率的变化
        Y_pred = predict(X, theta, theta_0)
        Y_hat = np.round(Y_pred)
        train_acc.append(accuracy(Y_hat, Y))
        train_cost.append(cost(Y_pred, Y, num_train))
        #记录每个epoch更新后,测试集上损失的变化和准确率的变化
        Y_test_pred = predict(X_test, theta, theta_0)
        Y_test_hat = np.round(Y_test_pred)
        test_acc.append(accuracy(Y_test_hat, Y_test))
        test_cost.append(cost(Y_test_pred, Y_test, num_test))

    return train_cost,test_cost,train_acc,test_acc

train_cost,test_cost,train_acc,test_acc = train(X, Y, theta, theta_0, max_iter, batch_size, learning_rate)
len(train_cost) #out: 40
Out[ ]:
40
任务七:观察模型在训练集和验证集上的表现
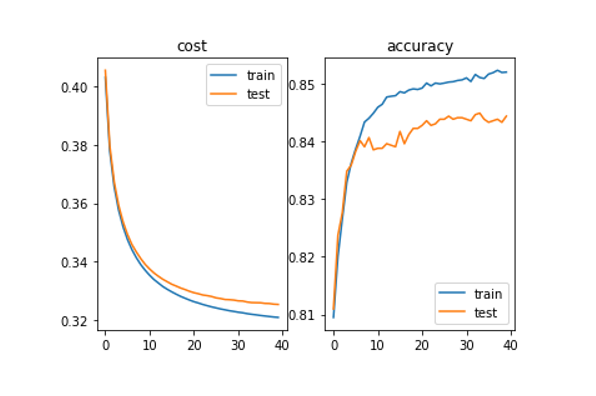
用matplotlib(plt)里的方法生成图表,观察随着迭代进行,模型损失和准确率的变化
In [ ]:
#子图1:损失
p1 = plt.subplot(121)
p1.plot(train_cost)
p1.plot(test_cost)
p1.legend(['train', 'test'])
p1.set_title("cost")

#子图2,准确率
p2 = plt.subplot(122)
p2.plot(train_acc)
p2.plot(test_acc)
p2.legend(['train', 'test'])
p2.set_title("accuracy")
plt.show()
样例输出:

由于训练过程有一定随机性,训练结果可能存在不同


0 条评论